PID Controller Simplified
This is an attempt to explain PID controller with minimum use of maths.
A simple closed loop control system consisting of a controller and a process (or plant) is shown below.

The input to the system is the ‘setpoint’, ie the desired output. The input to the controller is the error.
Error = Present Output – Setpoint.
The two steps in the design of a control system are –
1. Mathematically model the plant to be controlled.
2. Design the Controller.
The block diagram of a PID controller is shown below –
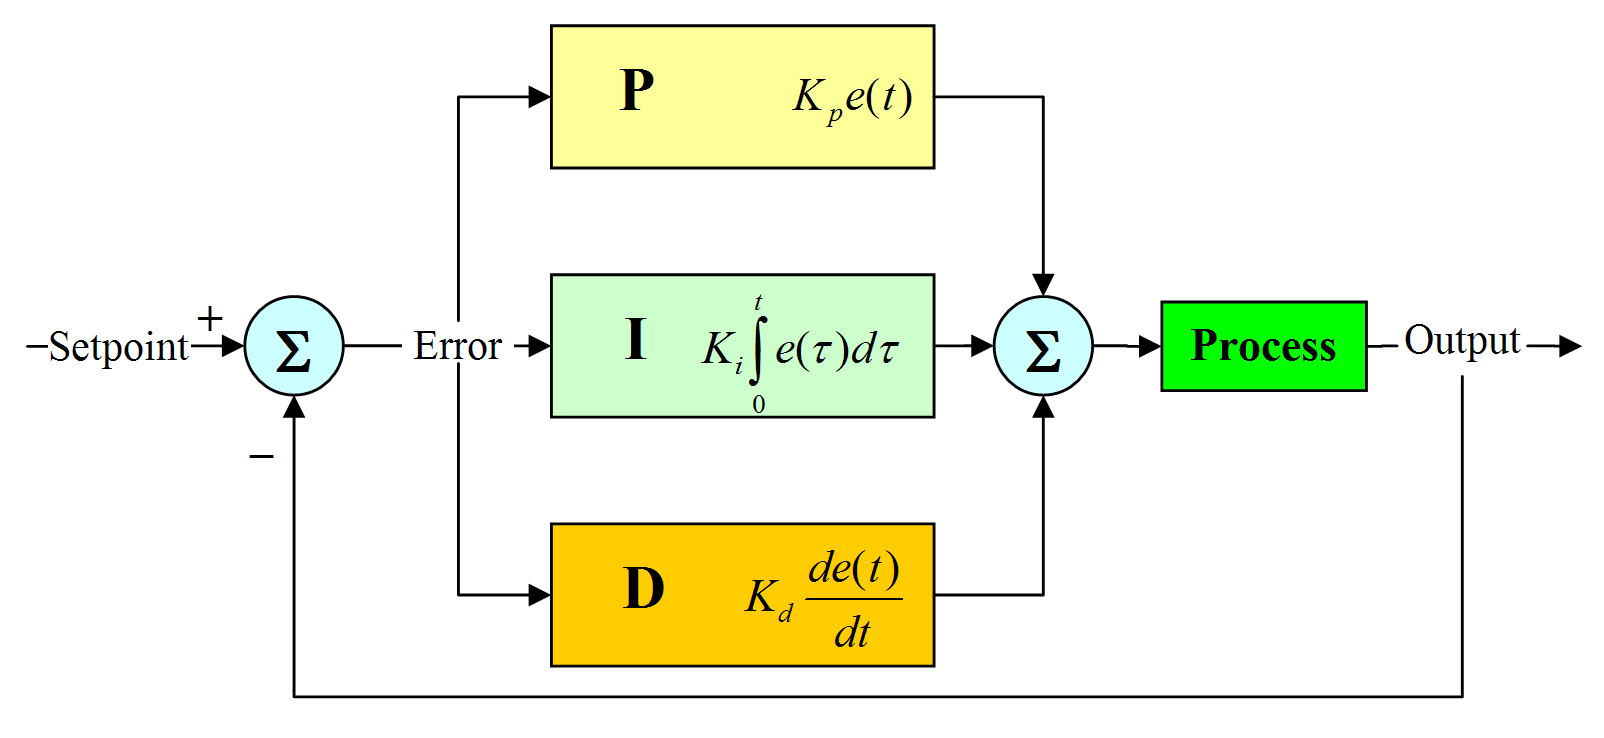
A PID controller consists of a Proportional element, an Integral element and a Derivative element, all three connected in parallel. All of them take the error as input. Kp, Ki, Kd are the gains of P, I and D elements respectively.
The best way to understand something is by simulating it. So I simulated a PID controller in matlab. The matlab code is provided at the end of this article.
Let me assume a suitable mathematical model for the plant and then go ahead with designing the controller.
Let the transfer function of the plant be 1 / ( s^2 + 20s + 30 ).
The step response of a system is the output of the system when the input to the system is a unit step. The open loop step response of the above plant is –
(Click on the image to get an enlarged picture)

It can be seen that the step response output is close to 0.035. The steady state error = 1-0.035 = 0.965. That’s quite high! Also observe that the settling time is around 3 sec.
Now lets see what is the effect of PID controller on the system response.
Lets see the effect of proportional element on the system output.
Keeping Kp = 10, Ki = 0, Kd = 0 the step response of the system is

The output is now 0.25. Much better than the open loop response! (The curve in red shows the open loop step response of the plant)
Now let me increase the Kp further and observe the response.
Keeping Kp = 100, Ki = 0, Kd = 0 the step response of the system is

The output is now 0.77. So it’s clear now that increasing Kp will reduce the steady state error.
Keeping Kp = 200, Ki = 0, Kd = 0 the step response of the system is

The output is around 0.87. Also observe that the ripples have started appearing in the output. If Kp is increased further it will only lead to increase in ripples or overshoot. The rise time also has decreased. Also observe that there is a small steady state error (1 – 0.87 = 0.13).
Conclusion –
Increasing Kp will reduce the steady state error.
After certain limit, increasing Kp will only increase overshoot.
Kp reduces rise time.
Now lets keep Kp fixed. Lets start varying Ki.
Keeping Kp = 200, Ki = 10, Kd = 0 the step response of the system is

The output is now close to 0.99. That’s very close to the setpoint. But observe that settling time has increased.
Keeping Kp = 200, Ki = 200, Kd = 0 the step response of the system is

Observe that rise time has now reduced and steady state error is very small.
Keeping Kp = 200, Ki = 300, Kd = 0 the step response of the system is

Observe that steady state error is close to 0 now. But increasing Ki has resulted in overshoot.
Further increasing Ki will only increase overshoot.
Conclusion –
Ki eliminates the steady state error.
After certain limit, increasing Ki will only increase overshoot.
Ki reduces rise time.
Now lets Keep Ki fixed and start varying Kd.
Keeping Kp = 200, Ki = 300 and Kd = 10.

Wow! What a response! Where is the overshoot? It has disappeared. There is a reduction in settling time as well.
Increasing Kd further will only result in response getting worsened.
Conclusion –
Kd decreases the overshoot.
Kd reduces settling time.
So the ideal PID values for our plant is Kp = 200, Ki = 300 and Kd = 10.
The above process is known as manual tuning of PID.
Here is the matlab code used to simulate PID –
(The below code is written by me. So please let me know if you find any bugs!)
num=1;
den=[1 20 30];
Plant = tf(num,den);
step(Plant,’r’);
hold on;
Kp=200;
P_Sys = tf(Kp,1);
Ki=300;
den2=[1 0];
I_Sys=tf(Ki,den2);
Kd=10;
num3=[Kd 0];
D_Sys=tf(num3,1);
PI=parallel(P_Sys,I_Sys);
PID=parallel(PI,D_Sys);
OpenLoop=series(PID,Plant);
ClsdLoop = feedback(OpenLoop,[1]);
step(ClsdLoop,’b’);


Good one dude, One doubt, is there a way of calculating the ideal values for kp,ki etc or is it only trial n error
It exists a software tool which calculates the ideal values kp, ki etc. based on measured data from the plant. Name is ICP “intelligent controller parameterization” from ExpertControl. it worked great and gave us at the same time all information about the plant (transfer funct., etc). There is no real alternative tool in terms of capabilities and functions.
Cheers, Honno
Refer this link for some loop tuning methods –
http://en.wikipedia.org/wiki/PID_controller#Loop_tuning
I know only manual tuning. 🙂
Simple and a good explanation of not only how the PID works but also the influence and use of the parameters Kp,Ki,Kd on the system.
as an additional note you should have mentioned that with Ki and Kd set to zero it is a proportional system and with kd = 0 it is PI system.
Question:
Why is that firt Kp, then Ki and Then Kd is set. what is the reason behind this order?
what happens if the order is changed?
@Bhanu,
Thanks.
The order Kp, Ki and Kd, are due to the effect of each on the response.
Its logical to set Kp first as Kp contributes maximum to the response. Kp can take the response close to the setpoint, but there will always be a steady state error present. The function of Ki is to eliminate steady state error. And finally Kd eliminates overshoot if any.
It dosnt make sense to change the order 🙂
@ Radhesh,
It was a good refresher. its simplicicity gives easier uderstanding for any.
@Banu and Radhesh,
I am not sure why u are you speaking about the order? The order is just for our own understanding otherwise, it has no importance.
@Radhesh,
u can just add one more explanation as follows:
kp=200,ki=0,kd=0 + kp=0 ,ki=300,kd=0 + kp=0,ki=0,kd=10
=
kp=200,ki=300,kd=10
@Murali,
Check out my previous comment to know the reason for that order 🙂
is this a non-minimal phase system?
This is a min-phase system – it has negative real parts of poles in the transfer-function. Simply put, this system is stable enough due to it’s poles occupying the left half of the s-plane and doesn’t have huge delays as is the case of the non-min phase systems. In any feedback control system, depending on the actuator and the process transfer function, corresponding controller parameters are decided. As to my knowledge of control systems, for this, the minimal phase or non minimal phase analysis is done for the process and actuator blocks and not the whole feedback loop, because it is these blocks which are controlled and we don’t normally control the closed-loop system itself!
But the control strategy of a non-minimal phase system is quite different to what PID can do – did you mean anything else?
hi
thanx for ur great explanation. got lot of info from that. as i am new to this control systems concepts. i may ask u some basic doubts. how to find the transfer function of the plant. suppose i have a position sensor which will detect the position of the motor. if i want to stop the motor rotation at certain setpoint. say 60 degrees. how do i get the transfer function of the system. and how do i calculate kp, kd, ki values if i want to use pid controller. if u have any notes for this plz forward to my mail id.
@Harish,
One of my friends have answered ur query. Here it is.
We would require the following info more:
1. Transfer-fn of the DC motor – how does the dc motor behave? Atleast a brief description of the motor behavior.
2. Transfer-function of the position-sensor – it could be I-, II- order with some delay associated with it.
Once they are known, we can find the parameters for our control system using closed-loop analysis. The Kp, Ti and Td are calculated using one of the many tuning methods(Ziegler-nichols method etc).
cool one . but can u include a sort of example based on the application od pid i.e a block diagram along wid an explanation. so that its easier to comprehend!
thanks bro, that was really cool
Hey. Thanks for this.
In the matlab code, you have:
step(Plant,’r’) and
step(ClsdLoop,’b’);
What are the r and the b for?
Cheers
@Student1
‘r’ and ‘b’ stand for red and blue colours respectively. They are used to indicate the colours in the plot.
Like i mentioned after the first post in this thread… it exists a software tool which calculates the ideal values kp, ki etc. based on measured data from the plant. No need to understand whats behind the software – just measure your plant, run icp and get required info. Name is ICP “intelligent controller parameterization” from ExpertControl. it worked great and gave us at the same time all information about the plant (transfer funct., etc). There is no real alternative tool in terms of capabilities and functions.
Cheers, Honno
nice discussion friends i would like to know about different algorithm to design a pid on computer ie in discrete time domain
thanks
can u please send me the matlab program for a actuator position controlled using a p,pd,pid,fuzzy controllers
Hey Radhesh,
Brilliant work. This has helped me understand PID Controller in a gist and without much time effort. The step by step approach is well devised to help anyone understand.
I have one small doubt regarding the equation:
Error = Present output – Setpoint
Common sense says error is deviation from desired – so that justifies the above equation, however as per the diagram
shouldnt that be
Error = Input(Setpoint) – Present output ??
Help me understand this
@Rakshith,
Thanks.
Yes you are right.
Error = Input(Setpoint) – Present output.
Error is indeed the deviation from the desired value. If error is +ve it indicates the setpoint is not reached, while if error is negative it indicates that the setpoint is overshot. It is the role of the controller to take the output closer to the setpoint.
kp is a linear contribution of the error so if the set point is exceeded or not reached the output of controller is proportional to this value so kp has a fair effect for transient and steady state response.
but for integral term the output of the controller depen on all the previous errors so it need more time in transient to over come the previous error values(the error may be negative but there is more previous positive errors)
for derevative term it is a good predector so it is very slow in transient response as it predect the increase and decrease in the system output from error value.
Hey Radhesh,
Yeah. I got the point.
Thank you for the clarification.
For a comprehensive collection of tutorials and demos on how to design and tune PID controllers in MATLAB and Simulink take a look at this page:
http://www.mathworks.com/discovery/pid-control.html
can i give me pid control..but real not used tf function
very nice explanation I am satisfied
hey. the explanation was nice.
I have one query.. what if instead of constant value( in your case it is 1), i want to set the program so that f(t), a function of time, follow a linearly increasing graph.
in that case will the k_p value still be constant?
or should i make it also a function of time???
*thanks in advance 🙂
Hi Sir,
Thanks A lot, Now i can teach my student about PID after read all the note above.BUT could u / anyone please to guide / explain,how about if i want to use FUZZY LOGIC to control my PID.Is there any example and explaination to get me understand on it ?Thanks for ur kindness
nice one dude!!!!
Nice friend ,keep it up.Simple but awesome description
Elibarick, thanks much for your lesson, now am comfortable for my coming test.
Thank u so much.i’m new to this concept. It helped me understand better and thanks again for code.
right now i’m trying to control a Oven with a temperature controller I created. How I get the transfer function and how I simulated it with Matlab? Please let me know if you can help me, its for a college project . Thanks
why KP ki values changes what happened to the system
Very nice description regarding PID. I got clear idea regarding this topic
I have 6 pluse scr bridge which is triged from controlling card i having software communication with card how should adjust vtg ki kp and current ki kp and what is effect of changing this on output plz explain
I have doubt…What will happen if i will keep my setpoint as zero
sir can u plz tell system response with PID controller and without PID controller?
Great stuff, just great! any important points are covered here. This is the right blog for anybody who really wants to understand this topic.